78 terms · 9,277 decisions
Trends & patterns
How the Court's caseload, vote splits, and issue focus have shifted since 1946.
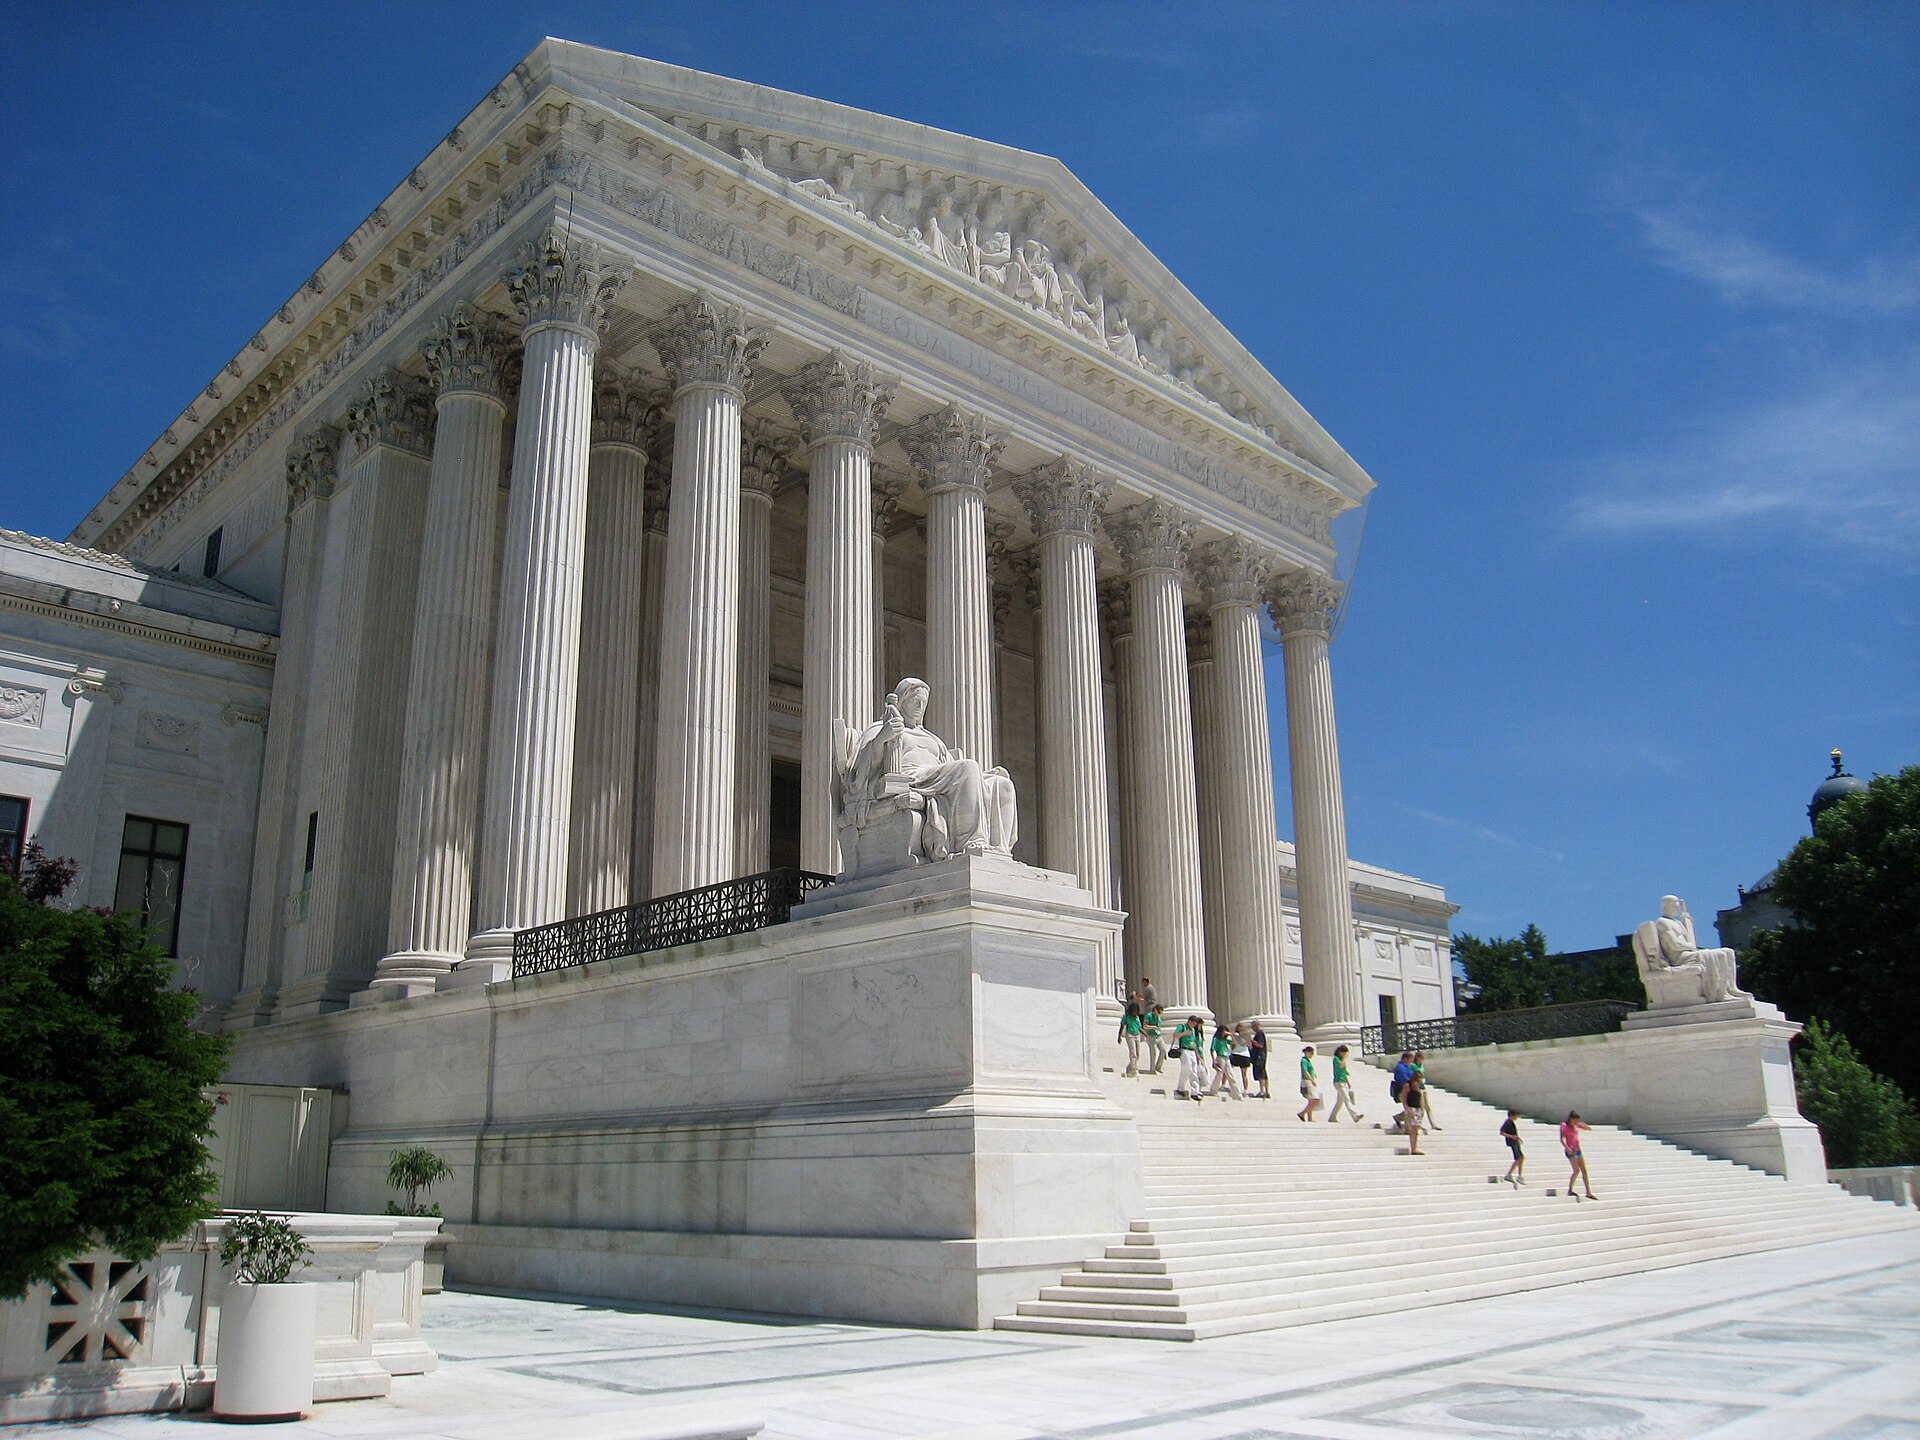
Photo: Daderot · Public domain · Wikimedia Commons · All photo credits
Charts
Cases decided per term
The docket has shrunk by roughly two thirds. The Court signed 197 decisions in the 1967 term and 59 in 2023.
5-4 decisions over time
Bare majorities peaked at 44 in the 1986 term. Since 2005 the Court has averaged 13.1 a term — fewer in number, out of a much smaller docket.
Majority-size distribution
Unanimity is the single most common outcome: 9-0 accounts for 2,696 of 9,277 decisions, more than any divided split.
Issue areas by decade
What the Court spends its docket on has shifted by decade — each bar is one decade’s decisions, split by issue area.
Petitioner win rate
The petitioner usually wins — about 64% across the period. The Court tends to grant review when it suspects error below, and the line sits above the even split for most of it.
Decision direction by term
Coded direction swings by era rather than trending. Across the whole period it is close to even: 4,442 conservative against 4,629 liberal.
What the charts show
The caseload line is the headline: an average of 146 signed decisions a term across 1946–1985, peaking at 197 in 1967, against an average of 68 over the last ten terms. The 2023 term produced 59 decisions.
Bare majorities moved the other way: 5–4 splits were 13.1% of decisions in 1946–1985 and 17.6% from 2005 on. Across the whole dataset 2,696 decisions were unanimous and 1,403 were 5–4.
Issue-area and direction codes come from SCDB’s coding conventions and involve editorial judgement — they are most useful for longitudinal comparison, not for characterising any single case. See Methodology & sources.